In The Billions and Linear Modeling
Task
The data in the table below was taken from Wikipedia.
| Year | World Population (Estimate) |
| 1804 | 1 |
| 1927 | 2 |
| 1960 | 3 |
| 1974 | 4 |
| 1987 | 5 |
| 1999 | 6 |
| 2012 | 7 |
- Based on the data in the above table, would a linear function be appropriate to model the relationship between the world population and the year? Explain how you know.
- Using only the data from 1960 onward in the above table, would a linear function be appropriate to approximate the relationship between the world population and the year? Explain how you know.
- Based on your work in parts (a) and (b), would a linear function be appropriate to predict the world population in 2200? Explain.
IM Commentary
This problem assumes students have completed several preliminary tasks about the fact that linear functions change by equal differences over equal intervals (e.g., F-LE US Population 1982-1988 and F-LE Equal Differences over Equal Intervals I and II).
Solution
-
The table below gives, in the first column, the number of years required
for the population to grow by one billion after first reaching one billion
near 1804. Then the third column provides the annual growth rate over
the period specified in the first column.
The rate of change of population growth is far slower for the period prior to 1960 than it is after 1960. Since a linear function is characterized by having the same growth rate over equal intervals (in this case the intervals are years) this data for the world population is not well modeled by a linear function.Change in Years Change in World Population Annual Rate of Population
Change (people/year)1927 - 1804 = 123 1,000,000,000 8,130,081 1960 - 1927 = 33 1,000,000,000 30,303,030 1974 - 1960 = 14 1,000,000,000 71,428,571 1987 - 1974= 13 1,000,000,000 76,923,077 1999 - 1987= 12 1,000,000,000 83,333,333 2012 - 1999= 13 1,000,000,000 76,923,077 -
From 1960 onward the growth rate is remarkably steady, increasing by one billion approximately every 13 years. So a linear function would be appropriate to model the data from 1960 through 2012. One possible linear model, graphed below, is $$ f(x) = 3 + \frac{x}{13} $$ where the input represents the number of years since 1960, and the output represents the approximate world population in billions.
Though the population growth is closely approximated by this linear function $f$, it is not exactly linear. The number of years required for the population to increase by one billion varies between 12 and 14 years with an average of 13 years for the period from 1960 through 2012.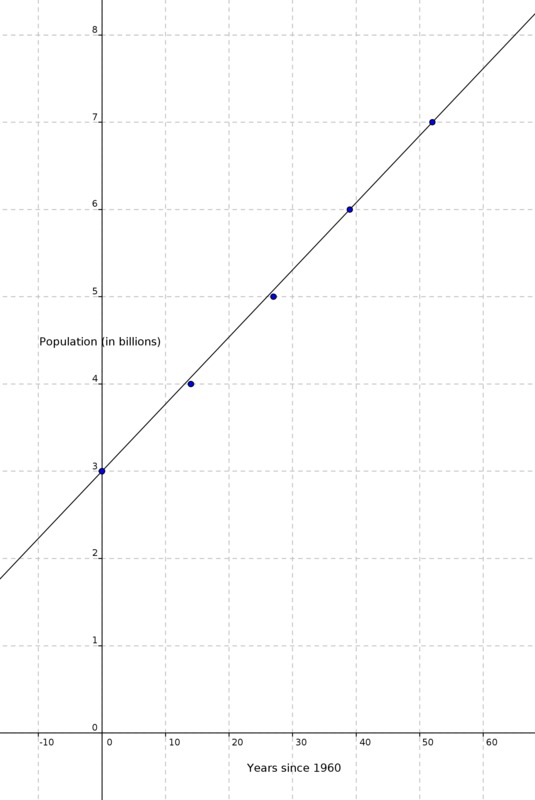
- It is impossible to say with certainty how the world population will evolve over the next two hundred years. If the current growth rate, captured in part (b) of the problem, were to continue then we would expect, in the year 2200, a population of about $$ f(2200) = f(1960 + 240) = 3 + \frac{240}{13} $$ billion people, or about 21 and a half billion people. It seems unlikely that this is a good estimate as the human population is probably currently approaching the critical point where adequate resources are no longer sufficient to sustain the current rate of growth.
In The Billions and Linear Modeling
The data in the table below was taken from Wikipedia.
| Year | World Population (Estimate) |
| 1804 | 1 |
| 1927 | 2 |
| 1960 | 3 |
| 1974 | 4 |
| 1987 | 5 |
| 1999 | 6 |
| 2012 | 7 |
- Based on the data in the above table, would a linear function be appropriate to model the relationship between the world population and the year? Explain how you know.
- Using only the data from 1960 onward in the above table, would a linear function be appropriate to approximate the relationship between the world population and the year? Explain how you know.
- Based on your work in parts (a) and (b), would a linear function be appropriate to predict the world population in 2200? Explain.